
Sustained throughput benchmark
Edit this page
SQLStreams sustained approximately 68,000 messages/s produced and consumed with 1,000-byte JSON messages on an M4 MacBook Air running native PostgreSQL 18.6.
Unfortunately we live in a cruel world and these results are only ‘okay’ and not ‘nice’.
Results
Each row is one consecutive 30-minute run on September 11, 2026, using the same frozen binary and configuration. The database was recreated between runs; PostgreSQL was not restarted. Each run’s rate is the lower of producing and consuming rates, and the headline is the median of those three rates.
| Run | Produced/s | Consumed/s | Backlog slope, messages/s | Logged maintenance failures | Verdict |
|---|---|---|---|---|---|
| 1 | 74,130 | 74,129 | +5.50 | 2 | Pass |
| 2 | 68,185 | 68,188 | −0.61 | 0 | Pass |
| 3 | 66,141 | 66,152 | −2.34 | 0 | Pass |
All three runs passed the backlog check and finished with equal produced and handled counters: 398,139,000 messages across the full runs, including warmup. Rejected produces, unknown outcomes, and handler errors were zero. The backlog check allows a fitted slope up to 10 messages/s for unpaced runs; it does not require every instantaneous backlog sample to be zero.
Run 1 logged two janitor partition-drop lock timeouts and retried. Runs 2 and 3 logged none. Maintenance retries are reported separately from application errors; a passing verdict does not mean maintenance never retried. Log suppression can hide additional occurrences, so these are recorded counts.
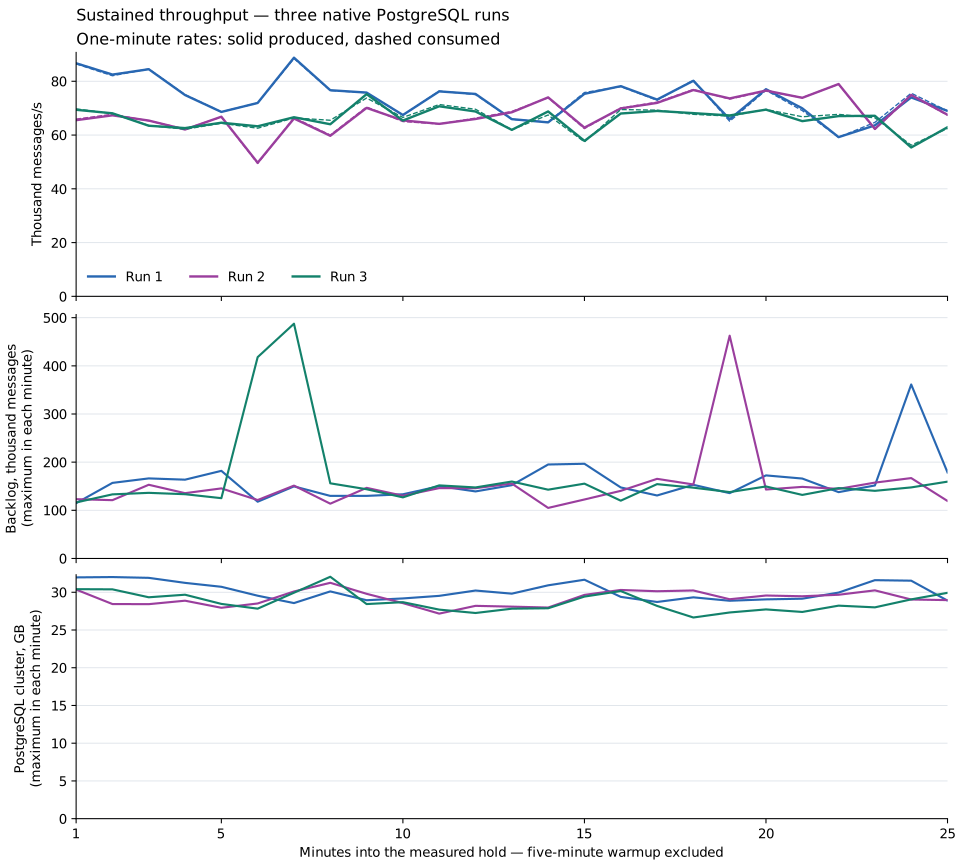
Rates are one-minute averages from counter snapshots. Backlog and storage show the maximum observed in each minute. Backlog includes allocated messages and work still in flight. PostgreSQL storage includes data and WAL; the combined local benchmark footprint, including earlier retained artifacts, peaked at 84.62 GB against the 100 GB cap. All three run databases were dropped afterward.
Workload and evidence
The orders stream has one processor consumer group. Handlers return success
without application work. Producers use explicit batches of 250 messages with
four concurrent callers. Retention, idempotency-key cleanup, autovacuum, and
scheduled vacuum remain enabled throughout the runs.
The evidence directory contains the machine-readable results, source snapshot, build manifest, and all three linked run archives. Each run archive retains its declaration, environment, effective settings, raw counters, backlog and storage samples, logs, and original verdict. No run was replaced or excluded. The host monitor observed no integration/test container activity or Go build/test processes during the measurements.
CPU headroom is informational for maximum-throughput runs. Crossing its 80% threshold does not fail that scenario; all three runs recorded zero crossings. Backlog and application-error checks remain required. Older verdicts retain the rules under which they were produced.
Per-message recording is disabled to avoid its JSON and disk-write overhead. Aggregate counters measure rates and totals; they do not prove that every individual message was handled exactly once. Detailed latency is unavailable in these runs. The quiet scenario retains full recording for its identity checks (0687).
Multi-stream ceiling
Streams do not contend with each other in PostgreSQL. What contends is the two consumer groups on one stream. That is the result of driving one deployment shape unpaced over 1, 4, and 16 streams on September 12, 2026: two consumer groups on every stream with a delivery-log row per delivery, explicit batches of 250 from four callers per stream, a 64-connection pool per process, and aggregate counters instead of per-message records. Each stream count ran a 30-second warmup and a two-minute unpaced hold three times from one build; the table is the median of the three holds with the full range, and every run passed.
| Streams | Produced/s | Consumed/s, all groups | Backlog slope, messages/s | PostgreSQL CPU, cores | WAL per message |
|---|---|---|---|---|---|
| 1 | 43,027 (41,023–49,078) | 37,861 (36,320–42,908) | +23,482 | 3.7 (3.6–4.0) | 2.2 KB |
| 4 | 42,641 (42,135–46,632) | 77,892 (77,837–83,330) | +2,015 | 6.1 (5.8–6.3) | 2.0 KB |
| 16 | 45,558 (42,574–45,994) | 83,185 (80,534–85,344) | +300 | 5.7 (5.7–5.8) | 2.1 KB |
Production sits near 43,000/s at every stream count and its wall is the producer container’s two-CPU cap, which the headroom check crossed 11 to 27 times per hold on 4 and 16 streams and never on 1. Consumption is what fans out: on one stream each group manages about 19,000/s and the backlog grows by 23,000 messages every second; on four streams each group nearly doubles and on sixteen the backlog is flat. WAL per message and checkpoints (five to seven per run) stay the same from 1 stream to 16, so the database does the same work per message however the streams are cut.
These ran under Docker Compose, unlike the native setup above: PostgreSQL 18.4
capped at 8 CPUs and 8 GiB, producer and consumer containers capped at 2 CPUs
each, on the same M4 host, library commit 52cfcb2c with unrelated CLI work
uncommitted in the tree. The runs are back to back, and each repetition
produced up to ten percent less than the one before it; the ranges carry that.
The rates are two-minute burst ceilings. A sustained number needs the
25-minute shape above, and no two-minute run spans a checkpoint timeout on
its own.
One number from these runs is guidance. The library’s
default pool is ten connections, and a paced run with sixteen batch workers
per stream on that default queued at about 4,500 produces per second however
many streams it used (0767). PostgresConnectionConfig.MaxConns
is the setting that moves it.
The multi-stream ledgers hold every run’s verdict,
including an exploratory first run per stream count that the medians exclude.
Run directories with logs, counters, and effective settings are not tracked.
The current runner reproduces a stream count with
just bench multistream-unpaced-4 1 5m 3 from a checkout with Docker
running; just bench-report multistream-unpaced-4 prints the medians.
Configuration
All processes run on the same MacBook Air: Apple M4, ten CPU cores, 24 GiB of memory, and an internal 512 GB Apple AP0512Z SSD. PostgreSQL 18.6 runs natively on macOS; producers and consumers connect over loopback TCP.
| Setting | Value |
|---|---|
| Producer processes / concurrent callers | 1 / 4 |
| Explicit batch size / batch concurrency | 250 / 4 |
| Connection pool maximum | 8 per application process |
| Consumer processes / handler concurrency | 1 / 4 |
| Consumer claim batch / queue capacity | 16,000 / 64,000 messages |
| Consumer claim polling | 100 ms |
| Payload | 1,000-byte JSON, identity fields and repeated padding |
| Message and idempotency-key retention | 120 seconds |
| Partition size | 1,000,000 messages |
| Janitor polling / delete batch | 1 second / 10,000 rows |
| Partial-sweep grace / cleanup timeout | 30 seconds / 30 seconds |
| Scheduled vacuum polling / timeout | 120 seconds / 60 seconds |
| Application runtime | GOMAXPROCS=4, GOGC=400, GOMEMLIMIT=2GiB |
| PostgreSQL shared buffers / work memory | 6 GiB / 32 MiB |
| Maximum / minimum WAL size | 8 GiB / 2 GiB |
| Checkpoint timeout / completion target | 5 minutes / 0.9 |
| PostgreSQL maximum connections | 200 |
| Instrumentation | pg_stat_statements, I/O timing, WAL I/O timing |
| JIT | off |
fsync, synchronous_commit, full_page_writes, and autovacuum stay on.
GOMEMLIMIT is a Go runtime target, not a process memory cap; PostgreSQL has
no imposed CPU or total-memory quota. Successful deliveries do not create
per-message delivery-log entries. Exception consumers are suspended, and no
failures are injected.
These settings deliberately exercise retention every few minutes. They are not the library defaults or a recommendation to retain production messages for two minutes. Application work inside the handler, remote database access, additional consumer groups, and a different payload change the workload.
Reproduce the published runs
The current runner uses just bench <scenario>, with just bench-smoke for
a one-minute quiet run and just bench-report <scenario> for saved results.
The commands below use the frozen source that produced these published
results, including its original paths and binary names.
Use PostgreSQL 18.6 and Go 1.27. Download the source archive and
PostgreSQL configuration into an evidence directory outside
the checkout. In a separate checkout at base revision
ce33ff2cc834ad781cd68913a1acd86d6a8faafc, extract the source archive before
building. It includes the benchmark changes and local Go workspace; the
manifest records its SHA-256 hash.
From that checkout, run the following on macOS. It creates a dedicated native cluster, runs the same scenario three times, and stops the cluster afterward. The runner drops each run’s database and retains the result files. Its storage guard stops a run at 100 GB of cluster-plus-result storage or below 40 GiB free. The publication session additionally counted earlier local benchmark artifacts against the same 100 GB cap.
set -eu
benchmark_evidence="/path/to/downloaded/evidence"
tar -xzf "$benchmark_evidence/source.tar.gz"
postgres_bin="$(brew --prefix postgresql@18)/bin"
benchmark_root="$(mktemp -d /tmp/sqlstreams-benchmark.XXXXXX)"
"$postgres_bin/initdb" -D "$benchmark_root/pgdata" -U scratch \
  --auth=trust --encoding=UTF8 --locale=C
cat "$benchmark_evidence/postgresql.conf" \
  >> "$benchmark_root/pgdata/postgresql.conf"
"$postgres_bin/pg_ctl" -D "$benchmark_root/pgdata" \
  -l "$benchmark_root/postgres.log" start
trap '"$postgres_bin/pg_ctl" -D "$benchmark_root/pgdata" stop -m fast' EXIT

(cd .bench && go build -o "$benchmark_root/reliability" ./reliability)
export GOMAXPROCS=4 GOGC=400 GOMEMLIMIT=2GiB
for benchmark_run in 1 2 3; do
  python3 .bench/reliability/native.py \
    --binary "$benchmark_root/reliability" \
    --postgres-bin "$postgres_bin" --port 55439 --user scratch \
    --scenario max-throughput
done
Keep integration tests, other database workloads, and builds out of the measured window. The settings are tuned for this host; reproduction on another machine measures that machine’s capacity. No additional handler work is included.